by Roy Hathaway
7 minute read
One of the biggest questions facing UK waste policy makers and commentators is: why have recycling rates in England levelled off?
Until recently it was assumed – not least by Government – that the steady increase in UK recycling which marked the last decade would continue indefinitely, thanks mainly to the landfill tax escalator.
Not any more. On present trends the UK won’t reach the European Union’s target of recycling 50% of household and similar waste by 2020. If that happens, the UK will face multi million Euro fines by the European Commission. This ought to make Ministers sit up and take notice, despite their current lack of interest in issues of resource efficiency and environmental protection.
We badly need to know exactly why progress towards higher recycling rates has stalled at just over 43%. To state the obvious, if we don’t correctly diagnose the cause of the problem, we won’t identify and apply the right policy solutions.
There is no shortage of theories out there which try to explain what is happening. But – perhaps due to a lack of hard evidence – there is no consensus. Here is my personal critique of some of the likely (and less likely) contributory factors, designed to provoke comment and (I hope) stimulate some proper research.
The garden of England
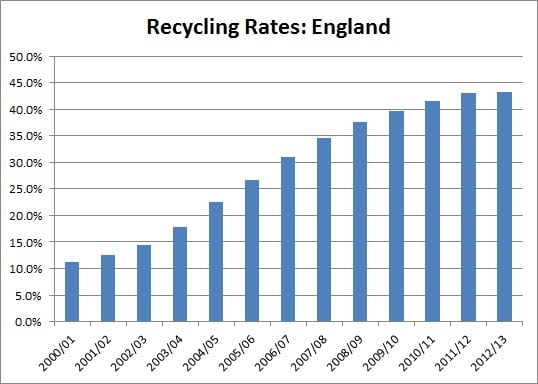
Let’s start by looking at the available data. According to the latest Defra annual statistics on waste managed by local authorities in England in 2012/13, published in November 2013, the total tonnage of household waste being collected for recycling and composting has been static for the last two years. Since 2010, any increases in the percentage recycling rate are attributable to the continuing fall in total household waste arisings, rather than any absolute increase in recycling or composting.
Even more striking is the heavy dependence of England’s recycling rates on green waste collected for composting. According to Defra’s figures, it made up about 40% of the waste collected for recycling, composting and reuse in 2012/13. Moreover, due to adverse weather conditions, the amount of green waste sent for composting in the first quarter of 2013 was over 27% lower than in the same period in 2012, exerting significant downward pressure on England’s overall recycling percentage.
Last year’s bad weather was (we hope) exceptional, and 2014 may well see garden waste collections return to earlier levels; unless, that is, other factors intervene. Several councils have introduced charges for garden waste collections in the interim, which can be expected to reduce collections; others may be changing policies to reflect the Environment Agency’s recent advice against composting of street sweepings, further reducing the amount of green waste composted. Be that as it may, many doubt that green waste is the whole story. Here are some of the other theories out there.
Green fatigue
Perhaps people are getting fed up with recycling because it’s too much effort and because some newspapers are telling them it’s a waste of time. According to this theory, all those who are prepared to recycle are already doing it, while the “antis” or “don’t cares” will not start now. I’m not sure I buy this. It doesn’t explain regional variations, and seems to overstate the power of inertia, while underplaying other influences. Kids are being switched on to recycling early on at school nowadays and they are the future recyclers – quite apart from the pressure they already exert on parents!

No longer on the up and up. The rise in recycling rates in England seems to have levelled off.
A more nuanced version of this argument recognises the huge divergence between urban and suburban/rural recycling performance, and suggests each has reached its practical maximum. The latter have all now raised their game and their recycling rates have levelled off. Meanwhile, inner city councils are unable to replicate that performance given demographic factors, e.g. high density housing and transient populations. Therefore councils and the waste industry need to make recycling easier and provide better services in these areas. I think there may be something in this argument.
Modern composition
Recyclables are forming less of our waste. For example, some believe less paper is being collected for recycling as we switch to on-line sources of news and other information. Others argue that any decline in newsprint is being offset by a rise in cardboard. Lightweighting of packaging materials for which the recycling rate is above the average may also be having a negative impact on rates; as will products switching packaging from (say) glass jars (heavy and recyclable) to multi-material sachets (light but not generally recyclable).
Another potential factor is that more products are offered on the go and disposed of in public residual waste bins. This could be significant – think of all the copies of the Metro left on trains and buses, and all the drinks cans and water bottles put in litter bins or just dropped in the street. Whether or not we’re wasting more on the go, we need to get better at recycling this material.
Yet another quirk is the current confusion over whether sending food waste for anaerobic digestion (AD) constitutes recycling, composting or just recovery. Defra itself seems unclear on this point. With the rapid growth in the AD sector, the definitive answer to this question could turn out to be statistically significant for recycling rates.
Ministers, MRFs and markets
Other theories are less “techie” and more controversial. Some say the fault lies with – you guessed it! – DCLG Ministers. The argument is that their hostility, and the lure of the Weekly Collection Support Scheme, have slowed the rate at which fortnightly residual collections and improved food waste collections are being rolled out by councils. If this is true we can expect to see the trend reverse when the weekly collections scheme money runs out in the next year or two. And to be fair to Mr Pickles (why not?) some local authorities have grabbed weekly collection fund money to introduce separate food waste collections; so this is far from a one way street.
Some see the operators of Material Recycling Facilities (MRFs) as the bad guys. The argument here is that in the past, MRF reject tonnages from co-mingled collections were not netted off the recycling statistics by councils reporting their figures to Defra under Waste Data Flow, whereas now they are. This one is hard to prove or disprove – is the difference between past and present netting off statistically significant? If not, are we simply saying that past waste statistics were an exaggeration? That won’t help bring us closer to our European target.
Another potential culprit in some eyes is the export of “Green List” recyclable waste to the Far East. With economic growth in China relatively sluggish, and the introduction of the “green fence”, exports to China are less buoyant than formerly, cutting the financial incentive to recycle. It is hard to see a direct link between lower recyclate prices and the household recycling rate. But in the longer term insufficient demand could be a potential worry for some recyclable materials.
Last but not least, perhaps the most controversial theory of all blames the slowdown in UK recycling on the rapid increase in EfW capacity in recent years. According to the Defra statistics for 2012/13, the amount of local authority managed waste going for EfW in England has more than doubled in the last 10 years, and now accounts for about 22% in all (compared to 34% going to landfill). Critics point out that EfW plants are often associated with long term contracts obliging councils to deliver set tonnages of feedstock over significant time periods; and that in some areas this is beginning to draw in recyclable materials as well as residual waste. This is a complicated question, worthy of detailed investigation in its own right. But I don’t think it can explain all of the slowdown in recycling we’ve seen to date. Defra’s figures show England still landfills 8.5 million tonnes of local authority managed waste, and nearly 30 million tonnes in total when C&I waste is added in. On the face of it, there is plenty of headroom for recycling to continue to grow. Those European countries which have reached 70% recycling rates also have big EfW sectors of 25-30%, alongside less than 5% landfill, so why can’t the UK follow suit?
The jury is out, and their deliberations could take some time. I’ve offered my educated guesses, but what do you think? Which of these theories are true; and how much difference does each make, whether singly or in combination? Over to you!
Like other Isonomia authors, Roy writes in a personal capacity. The views above do not necessarily reflect those of the Environmental Services Association.


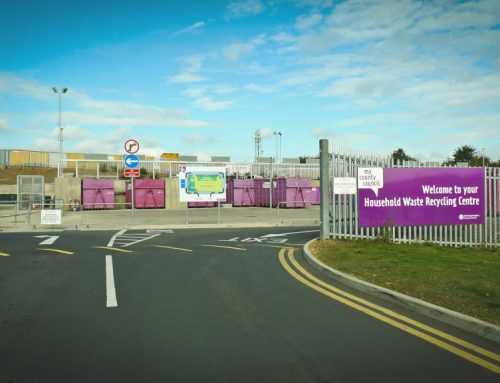
One possible factor to consider is that the removal of recycling banks in some areas and general tightening up of access to CA sites for C&I waste has meant a lot of small businesses who formerly made use of these facilities have had to make alternative arrangements. As avaialble data on C&I waste is so poor the impact of this is obviously very hard to quantify.
Surely the correlation with austerity measures and cutbacks t councils budgets is obvious here? The promotion of recycling as well has some physical services have been cut so of course recycling rates will reduce too
Thanks J, you may be right and it would be good to get views from local authority insiders on this. For what its worth, my gut feeling is that the levelling off of recycling rates had begun before the full impact of local authority cutbacks was felt, but I may be wrong. If anyone out there has an example of a council where this has happened, let us know!
The Landfill Tax escalator was certainly a driver, but its biggest effect would have been when it was first announced in 2007 it gave ’certainty’ about costs through to 2013. Since the last extension to the escalator was announced, each passing year has reduced the certainty. Now, instead of looking at a steep escalator we are looking at a flat surface – in fact a slightly declining surface as inflation erodes the £80/tonne tax that will be introduced in April. So the positive impact of the landfill tax on recycling has been gradually reducing and is now – if anything – tipping towards the negative. That said, LFT is only one of many drivers – your article identifies several other important ones.
Thanks Mike, I certainly agree the landfill tax escalator has been a major driver to this point and that more certainty over the future level of landfill tax would help a lot, not least in giving more confidence to would-be investors in waste infrastructure. Lets hope next month’s Budget addresses this. But the levelling off of recycling rates seems to predate the end of the escalator, so I feel there must be other factors involved.
Hi Roy – excellent piece, one I really enjoyed reading and that raises an important question.
One quick observation from me: in the years when recycling rates were rising fast, local authorities were investing heavily in improving their recycling services and increasing diversion. By 2010, most authorities had put decent services in place, so the rate at which new, much improved services appeared slowed. Now, with less money to spend, new tenders can be more focused on value for money than maximising diversion, so we’re not often getting the “step changes” in recycling rates we were seeing in the 2000s.
Does that seem plausible?
Thanks Peter, you raise an interesting point and one that sounds very plausible to me. It suggests perhaps that we should ask ourselves where the next “step change” in recycling is going to come from?
Where indeed? I don’t see a step change occurring without further legislative change to push material towards recycling, and any such measure will be controversial. Here are three suggestions. The ZWS research referred to by Simon Glen in his comment found that constraining residual capacity was the biggest driver of increased recycling – so measures to promote smaller bins or less frequent collections would appear to be the most effective measure, if unlikely under the current government. Food waste collections are still far from universal, and a requirement to sort this material would pull a good deal of additional material out of the residual waste stream. I’m concerned that EfW is, in some parts of the country, holding back recycling. A small incineration tax, like the Landfill Tax, would send out a useful message about where authorities should be focusing their efforts.
Thanks Peter, yes I guess the debate about the relationship of EfW to recycling rates will rumble on! Obviously important that the economic drivers are aligned with the waste hierarchy. I may be wrong, but I suspect Defra will ask HM Treasury to hold fire on incineration taxes at least until the 2020 landfill diversion targets are firmly in the bag.
Excellent piece of analysis – and it’s possible that all of the above may be the answer. The regression referred to above suggests that the most important factors affecting recycling rates are The Social demographics of the area, the frequency of residual waste collections, the number of materials targeted and the effective volume of collection capacity for recyclables (i.e. size of containers x frequency of collection). Those factors “explain” about half of variation in performance. Earlier WRAP research into the Barriers to recycling – which is now being updated for them by Resource Futures- identified the key behavioural issues which affect different types of household. If they are not being addressed then the “unwilling” or “unengaged” households will stay that way. Addressing the barriers will require funding for different collection systems and for effective communication – and that is likely to be in short supply.
The EfW issue needs proper investigation – the contractual arrangements may well be an obstacle but with the differential in gate fee prices between landfill, EfW and recycling there should be room for some arbitrage in which authorities are able to substitute some residual waste from another authority for their own material if that could be recycled instead.
What is clear from the waste composition stats – again assembled by Resource Futures- published by Defra is that recyclable materials constitute a significant part of the residual waste stream still.
It is over a year ago since I commented in a piece of my own on the slowing trend in recycling and my puzzlement that Defra showed no signs of asking what was going on and why? Perhaps the looming risk of default will energise them.
Thanks for your comments Phillip which are very interesting. As you say there must be a lot of local factors beneath the broad issues which I mention, and its good to know people have looked at those in the past and I hope will again. I agree with you that Defra ought to be investigating this as a matter of some urgency – perhaps they are?
All really interesting and succinctly put. May I ask, as we continue to compare ourselves with the percentage scores of other countries, do we measure recycling rate in the same way? Also, is recycling rate the best measure of sustainable waste management (as opposed to waste produced)? I know its the one everyone talks about!
Interesting point Andy – also well worth considering is the amount of waste produced per capita, and the carbon saving from recycling. Roy discussed figures on the former here:
https://www.isonomia.co.uk/?p=2308
And you might be interested in the Eunomia Recycling Carbon Index, which looked at the carbon savings that local authorities achieve:
http://www.eunomia.co.uk/product.php/219/1/recycling_carbon_index
The earlier piece to which Phillip refers was called “Curious numbers” and can be found here:
https://www.isonomia.co.uk/?p=1374
In Scotland in 2010, 3 of the cleverest people did a regression analysis to look statistically at the factors affecting recycling rates, quite interesting http://www2.wrap.org.uk/downloads/Remade_2009-10_-_Kerbside_Recyclate_Report_-_11th_August_2010_-_DraftFinal__2_.c9eb7fde.9850.pdf